At the NTEN NTC conference this year, I did a session on data visualization for nonprofits called “Picturing Your Data Is Better Than 1000 Numbers” with Johanna Morariu from Innonet and Brian Kennedy of ChildrenNow. Shortly after, I decided to start curating resources on data visualization over at Scoop.It and continue to add the best stuff to the resources section on the session wiki. In my reflection post about the panel, I was musing about one of the points raised: “How Can We Visualize Data If We Can’t Draw?” This is a common theme for those interested in incorporating visualization techniques.
In a post called, “Data Visualization and Data Art Continuum” the author quotes Stephen Few, a highly regarded data visualization expert:
“There is a distinction between data visualization (“the goal that data be visualized in a way that leads to understanding”) and data art (“visualizations of data that seek primarily to entertain or produce an aesthetic experience”).”
What he means is that there is a difference between eye candy infographics that are not conveying insights – and visualizing data. There is a tension between art/graphic design skills and visualization of ideas, insights, and concepts. He comes to the conclusion that: “There is no data visualization without graphic design and no data art without data.” I think there is a subtle distinction between “visual thinking” and drawing skills. Visualization of data requires visual thinking to be meaningful and you don’t need to be Picasso to be a good visual thinker and share your ideas in a drawing.
This brings me to the above presentation that I discovered on this blog post, “Visual Thinking at United Health Innovation Day” There is some really useful advice for those who think because they lack drawing skills, they can’t do data visualization or learn how to think visually.
The major problem or block to using visualization is that many people think drawing is just for artists and if you can’t draw well, than you shouldn’t bother to do it. That’s an assumption you need to challenge. It stops a lot of people from embracing visualization. It has stopped me in the past. But I followed the advice of colleague Rachel Smith, who teaches visual thinking and facilitation: “Send your inner critic who says you can’t draw on a vacation to Hawaii.”
The point that presentation makes is: Start thinking as drawing as a way to think!
To remove the mental block, it is okay to draw like a cavemen using symbols and low tech short cuts. Above all, return to your inner 6 year old. I’m not an artist, but giving myself permission to draw with my magic markers really helped me get past the block. You also need to learn and practice a visual alphabet. The two best resources to learn are: David Sibet’s “Visual Meetings” book and Dan Roam’s Blah Blah Blah: What To Do When Words Don’t Work. As you practice your visual alphabet, just accept imperfection, practice, and get better.
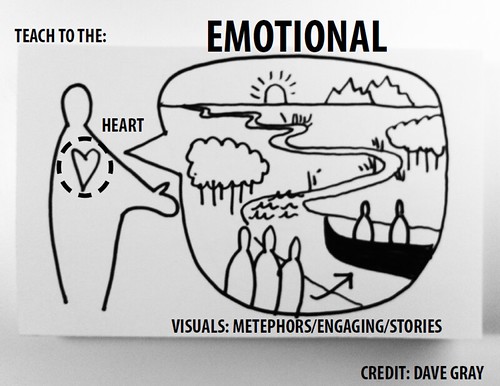
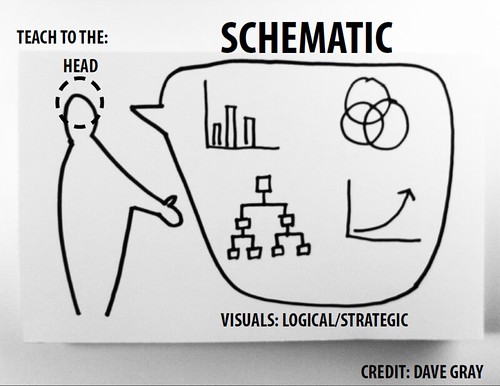
The presentation also notes that it is important match methods to the audience and their learning style. The styles are: head, heart, and hand.


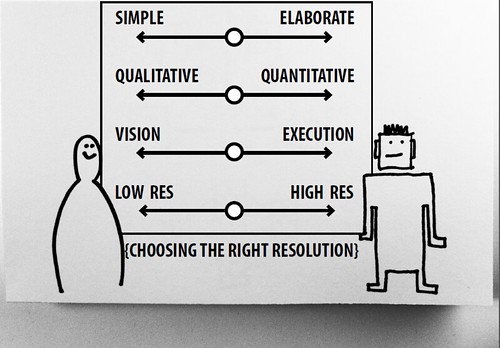
Another tip was about deciding on the resolution and I think this slide shows that visual thinking can be done with basic drawing skills or more advanced graphic skills.

The presentation ends with a great reflective question – why is it that we aren’t using visual thinking techniques in our organizations and our work, is it skills or cultural? It ends with some recommendations on how to change culture in an organization to embrace visual methods.
Are you using visualization techniques in your nonprofit? This might be data visualization, visualize facilitation at meetings, or other techniques. How?
