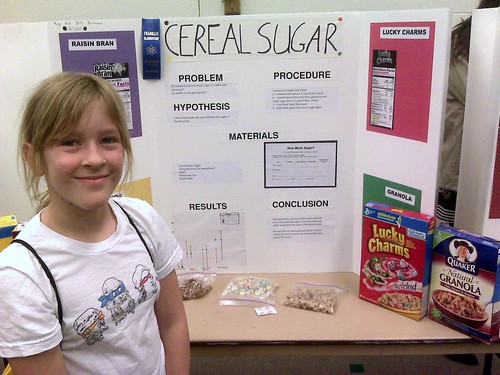
Note from Beth: Both my kids have worked on projects for their school’s science fair. They follow the scientific method which includes coming up with hypothesis question, collecting data, analyzing results, and getting insight to their questions. My daughter’s project involved testing different potting soils to see one was better for seed germination. As I was helping her translate the data in excel spreadsheet into a line graph, I realized that the project was essentially an a/b test.
As colleague Bob Filbin, DoSomething’s Data Scientist, pointed out in his presentation earlier this week, we can apply a/b testing to social media measurement. For example, one can test different wording for Facebook ads and use Google Analytics to see which one did the best in terms of converting people to an action.
It is important to understand that whether you are a/b testing for social media or email marketing or your 6th grade science fair, that the results of one test may not give you answers but more questions to test. What is important is the culture of testing and using the results to guide better decision-making which involves creating a culture of testing or what KD Paine and I called in our book, Measuring the Networked Nonprofit, “Data-Informed.”
How much does a photo in an email influence click-thru and gift giving behavior?By Shabbir Imber Safdar, Kate Harle, Dale Anania, from The Marine Mammal Center
The Marine Mammal Center (TMMC) is a marine mammal hospital and science research facility in Sausalito, CA. Since 1975, they have rescued nearly 18,000 seals, sea lions, dolphins, otters and other marine mammals from along 600 miles of California coast, with the aim of giving those in need a second chance at life in the wild. They also sell awesome Marine Mammal socks.
Experiment setup and hypothesis
One of the advantages of being a nonprofit that treats animals is that our patients have no expectation of privacy – we can publish images of the animal’s treatment without having to navigate complicated privacy laws like HIPAA. A few years ago my colleagues on the marketing team at The Marine Mammal Center were looking to find a way to write more impactful stories about their patients and we came across the patient x-ray as a powerful image to augment a patient story.
Thereafter our team was always on the lookout for a powerful x-ray to use as an image to go with a patient story. This technique has been adopted by others as well, such as WildCare Bay Area which did a story about an owl trapped in a tree with a fishhook and fishing line that prevented it from flying away.
So it was interesting to see The Marine Mammal Center latest A/B test experiment with a new patient, Duzzy, a California sea lion suffering from pneumonia. Two nearly identical emails about the case were sent to a split list of about 48,000 recipients, with one led by an x-ray showing inflammation demonstrating pneumonia, and the other with an image of the California sea lion looking very sick, lying on the beach before rescue.
Results
Because we don’t always trust “email open” reporting, we always check our statistical significance against both the reported opens and the entire delivery population. In this case we had a statistically significant difference in click-thru rate for the photo of the animal on the beach.
Interestingly, the number of gifts generated from each email were different, but not by a statistically significant difference. The “sick animal” version generated more gifts and email subscribes from people who clicked through it, but not more money. This was because of a single large gift generated by a visitor who received the x-ray email.
The lack of statistical difference in number of gifts could be explained by the fact that the handling (x-ray vs. sick animal) of the material was not carried through in the click-thru landing page. Landing and donation pages for both emails were identical.
Conclusions
It remains an open question as to whether or not an x-ray of a bullet would have performed better than the x-ray of the lungs, a fact we will not know until we have another gunshot animal to use as a patient story. In the meantime we can elevate pictures of sick animals as valid and powerful images on par with (some types of) patient x-rays and we can keep testing!
We’d love to hear from other animal hospitals out there. What sorts of experiments have you run with imagery? What works for you?Kate Harle and Dale Anania are the core marketing staff at The Marine Mammal Center, and Shabbir Imber Safdar (of Safdar Analytics) is their analytics consultant. Shabbir’s household owns at least one of every pair of marine mammal socks sold by the Marine Mammal Center.

Leave a Reply