

LOAD MORE POSTS
Find the Charlie's, Justine’s, and Edna’s in your network
I was honored to moderate a panel at Innogive Conference on the intersection of social and mobile strategy. I got to hear Scott Dunlap who is VP, Emerging Opportunities/New Ventures at PayPal deliver a great talk that offers some persona for different actors in your nonprofits network and how they influence, activate, or raise awareness for your cause through social channels. The slides are here. His points were: Each person does a little, the community does a lot “Does” is any action – … [Read more...]
Data Nerd Alert: Social Networking Benchmark Report
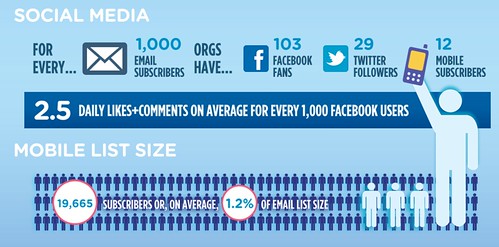
Note from Beth: This is a banner week for data nerds! Blackbaud, NTEN and Common Knowledge just released the fourth annual 2012 Nonprofit Social Networking Benchmark Report. Frank Barry shares this guest post summarizing results. 2012 Nonprofit Social Networking Benchmark Report [INFOGRAPHIC] guest post by Frank Barry Blackbaud, NTEN and Common Knowledge just released the fourth annual 2012 Nonprofit Social Networking Benchmark Report. We learned a lot of things, but one prevailing theme … [Read more...]
Attention Nonprofit Data Nerds: The 2012 eNonprofit Benchmarks Study Is Here
I've spent the last 9 months working on a book with measurement guru, KD Paine, called "Measuring the Networked Nonprofit" (sign up here to get a notice when it is available). One big lesson that I learned about measurement from KD Paine was a systematic, step-by-step approach to measurement. One of those steps is "Establish Benchmarks." Many nonprofits may set measurable goals then they ask an existential question: “How do we know that we’ve identified the right number?” Measurement … [Read more...]
Reflections from 12NTC Panel on Data Visualization
Last week I participated on a panel on "Data Visualization for Nonprofits: A Picture Is Better Than A 1,000 Words" with Johanna Morariu from Innonet and Brian Kennedy of ChildrenNow. The day of the panel, I published a blog post that shared our slides, wiki, and resources. But the really wonderful thing about the Nonprofit Technology Conference, is that the knowledge capture is superb. Our session was documented in many different ways as described below. Knowledge capture makes it … [Read more...]
Reflections from NTC Plenary Panel on Innovation
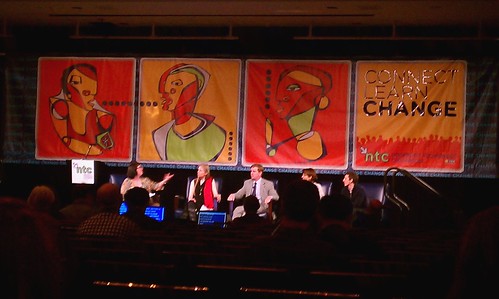
I had the honored of moderating a free wheeling plenary discussion on Day #3 of NTC on "Innovation and Nonprofits." The panelists included Laura Arrillaga-Andreessen, Meg Garlinghouse, Greg Baldwin, and Brian Reich. You can find the description and bios here and if you want to the video of the whole session, you can find it here. The conversation was non-linear, insightful, and allowed for debate on different points of view from the panelists. I kicked it off with a provactive question, … [Read more...]
Packard Foundation OE Launches Their Strategy Refresh Site
Note From Beth: Last month I had the pleasure of co-presenting at the GEO Conference (Grantmakers for Effective Organizations) with Kathy Reich, Director, Organizational Effectiveness Program at the Packard Foundation and Jared Raynor, Director of Evaluation at TCC Group, that helped OE analyze its "goldmine" of grantee data. The learning in public (slides and resources here). During the conference, "a small army of guest bloggers [and] grantmakers, who [attended GEO] posted their reflections … [Read more...]
Nonprofit Technology Conference Withdrawal
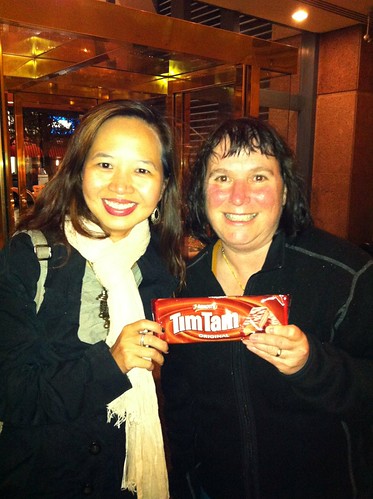
The 2012 Nonprofit Technology Conference (NTC) was the 12th conference that I have attended (it had earlier reiterations). Every year it is like attending a family reunion. I have some many friends and colleagues that I only get to see once a year at the NTC. For example, my colleague Shai Coggins from Connecting Up (the Australian version of NTEN), who always brings me Tim-Tams. The annual awards luncheon is always one of my favorites and this year was a little bittersweet. The Life … [Read more...]
NTC: Data Visualization Panel
NTC 2012: Data Visualizaiton Panel View more presentations from Beth Kanter I’m here at the 2012 Nonprofit Technology Conference in San Francisco this week. I am on a panel about measurement: Picturing Your Data is Better Than 1,000 Numbers:Data Visualization Techniques for Social Change Are you intrigued by infographics and how they could improve your communication strategy? Are you interested in what it takes for an organization to systematically use data? Or are you maybe even … [Read more...]
- « Previous Page
- 1
- …
- 95
- 96
- 97
- 98
- 99
- …
- 146
- Next Page »