• Skip to primary navigation
  • Skip to main content
  • Skip to primary sidebar
  • Skip to footer

Beth Kanter

Beth Kanter is a consultant, author, influencer. virtual trainer & nonprofit innovator in digital transformation & workplace wellbeing.

  • About Beth
    • Awards
    • Profiles
    • Press
    • Books & Projects
  • How Can I Help You?
    • Keynotes & Workshops
    • Training & Facilitation
    • Resources
  • Books & Projects
  • Beth’s Blog
  • TwitterTwitter
  • LinkedIn
  • Instagram
  • CONTACT ME

How To Make Sense of Your Social Media Metrics

May 31, 2013 Filed Under: Measurement

I’ve been facilitating a peer learning group with Packard Foundation grantees during the past year with a goal of improving measurement practice for social media and based on my book, “Measuring the Networked Nonprofit.”    Each organization is working on an action learning project that is a small, doable measurement project that applies the frameworks and steps in the book.   Each month, we go deep into a practice step – both on the individual practitioner level as well as the organizational practice level.    As the facilitator and SME,  I provide some content, but participants do a lot of sharing and presenting as well.  This helps spread good practices.
This group started the process with doing the hard work of identifying success and key performance indicators, but applying a organizational process to get everyone on the same page and reporting back.    Once settled, we took deep dives into understanding how to collect, analyze, and visualize data to apply to better decision-making.       The spreadsheet above is from the Community Foundation of Santa Cruz County for an action learning project that focused on measuring the results of the recently launched blog.
On a call last month,  participants shared examples of their measurement tools and spreadsheets.   Another participant, Compass,also working on measuring their blog, shared their spreadsheet for tracking similar indicators.    This inspired the team over at the Community Foundation of Santa Cruz County – even though their organizations are vastly different.   They adapted Liz Neeley from Compass’s spreadsheet!    They collected the data and now were ready to set up their dashboard.

On this month’s call, we focused on the sense-making process, which I’ll describe more below.    But, the Luis Chabolla and Kim East were ready now to customized an Excel Spreadsheet to serve as their reporting dashboard.  (See above).   They worked with their web site designer/developer, Embolden, to identify what data they needed from Google Analytics and created the above simple dashboard.     One of the topics the peer learning group took a deep dive into was selecting the right chart and techniques offered by nonprofit data nerds Stephanie Evergreen (who write a guest post on how to create great graphs) and Anne Emery’s tips on how to avoid boring bar charts.
What I always love about peer learning approaches is that we slow down, take it in small steps, and begin to build good practices.  These small steps add up to good, hopefully sustainable organizational habits over time.
 
[slideshare id=22150817&doc=slideshare-howdoisayitwithcharts-130529143823-phpapp02]
The second thing that I really enjoy about facilitating peer learning is that I learn along with the group. As you’ll see in the deck above, I shared my own little action learning project on how to improve my own data using Excel and Ann and Stephanie’s advice. The session was devoted to sense-making.
Sense-Making:  Organizational Indicators
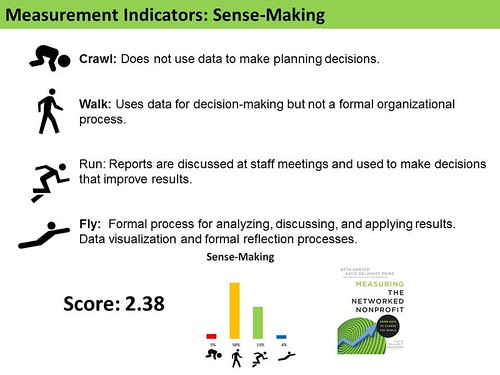
My Crawl, Walk, Run, Fly assessment has an indicator for the sense-making part of the measurement process.  This is an organizational level of practice.      But we also looked at sense-making from a practitioner level because most people in the peer group are either doing this work themselves or managing someone who is.     You need both the skills and organizational level of practice to see a transformational change in the organization as a result of the capacity building program.

I enjoyed breaking down each step of the sense-making process because for some this is the mysterious part of the measurement process.     The participants has a selection of resources to draw from for each step or just an overview – so they could go as deep as they wanted.
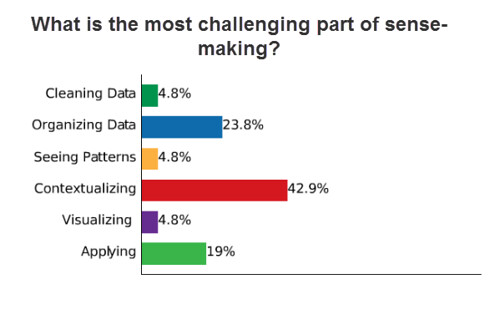
We then has a very thoughtful discussion about what part of the process was a challenge and where they feel they are doing a terrific job.  One theme that popped up was that good sense-making happens at the organizational level when you have your team or others in your organization look at results.
I think sense-making is my favorite part of the measurement process, even though it can be difficult.  And I love facilitating, designing, and delivering workshops on this topic!
What do you find easy in terms of sense-making of your data?  What do you find to be a challenge?

Reader Interactions

Comments

  1. jay goulart says

    June 1, 2013 at 9:43 am

    Beth,
    Very interesting work. The nonprofit sector for decades has been underperforming, see the AFP effectiveness report, in regard to metrics and departmental silos. These silos have contributed
    It would be interesting to look at social metrics outside the silo of social metrics. For example: performance in the social space on is a piece of something much bigger. What is the correlation between individuals their exchanges in the networked world and their giving and retention.
    My work over the past decade has led to mapping donor momentum first and then tying that performance to over all communication strategy which includes social engagement along with other touches.
    I applaud your focus on team, such a critical piece in creating a culture that has the capacity to produce significant results.

    • Beth says

      June 1, 2013 at 9:55 am

      Jay: Not sure if you have read my book, Measuring the Networked Nonprofit – but that is the focus — mapping metrics to overall organizational outcomes and social media/communications strategies within that.

  2. jay goulart says

    June 1, 2013 at 10:08 am

    Beth,
    Absolutely, I purchased your book. Would mind helping me and pointing me to the specific section of the book you’re referencing…that would be so helpful and appreciated, I would love to dig deeper into this topic and get past the generalizations and learn from your extensive experience. Thanks so much!

  3. Beth says

    June 1, 2013 at 5:05 pm

    The chapter called “Don’t confuse activity with results.”

  4. Liz says

    June 11, 2013 at 9:14 am

    This is a great blog post and I would love to share it with my colleagues, but many of them are visually impaired and the images have no alt text. It would be wonderful if you could make it a practice to add alt tags, especially for information-rich graphics like these. Thank you!

    • Beth says

      June 12, 2013 at 7:02 am

      Liz: Thank you for pointing that out and will be on diligent in doing that moving forward.

  5. Nick Stamoulis of Brick Marketing says

    June 12, 2013 at 6:40 am

    The social media goals of each business are slightly different. The first thing that you need to decide is what the goal is and then determine how that will be measured. It’s important to keep in mind that social media is just one of many touchpoints.

  6. Sean says

    June 13, 2013 at 10:02 am

    Great job. I tried downloading some of the templates, but none of the links seem to be working.

  7. Beth says

    June 15, 2013 at 10:57 am

    Hi Sean: I just checked all the links and was able to download the templates. They link over to a dropbox folder and you can download from there.

Trackbacks

  1. How To Make Sense of Your Social Media Metrics ... says:
    May 31, 2013 at 3:33 pm

    […] I've been facilitating a peer learning group with Packard Foundation grantees during the past year with a goal of improving measurement practice for social media and based on my book, "Measuring the Networked Nonprofit." Each organization is working…  […]

  2. Non-Profit Weekly Resource Guide, 9th ed. says:
    June 7, 2013 at 5:05 am

    […] The always brillant Beth Kanter shares How to Make Sense of Your Social Media Metrics […]

  3. Networking, dealing with disasters, and grad school: What happened this week | Idealist Careers says:
    June 7, 2013 at 9:00 am

    […] Beth Kanter advises readers on how to make the most of your organization’s social media metrics. […]

  4. Weekend Update - June01 - Internet Marketing For Schools says:
    June 8, 2013 at 8:50 am

    […] Post: How To Make Sense of Your Social Media Metrics – I’ve been facilitating a peer learning group with Packard Foundation grantees during the […]

  5. Blog Posts to Read for June 20, 2013 says:
    June 20, 2013 at 12:01 am

    […] How To Make Sense of Your Social Media Metrics By: Beth Kanter Metrics are one thing. Understanding of all of your data is another. Here are some different ways to make sense of your social media data. […]

  6. Understanding Social Media Metrics | Tech ImpactTech Impact says:
    June 22, 2013 at 10:36 am

    […] for some data can be hard to measure and contextualize, and according to a recent post from Beth Kanter’s Blog, it can help to discuss your strategy with people who are attempting the same thing. When you pull […]

Primary Sidebar

Categories

Never miss a post!
Name: 
Your email address:*
Please wait...
Please enter all required fields Click to hide
Correct invalid entries Click to hide
Powered by FeedBlitz

Related Posts

Try Exercise Snacking for Improving #WFH Mental Health

#Fakecommute: A Ritual for Work-Life Balance When You #WFH

New Year’s Rituals for Nonprofits To Improve Resilience in 2021

#AI4Good: Artificial Intelligence & Wellbeing, Ethical Dilemmas, and More

Philgorithms: Two Examples of Data Mapping to Guide Donor Decisions

Future of Giving: Coordination, Donor Retention & Artificial Intelligence

Simple Ways To Reduce Virtual Fatigue for Nonprofit Leaders

Footer

Trainer, Speaker, Author

About Me
Books & Projects
Beth’s Blog
Keynotes & Workshops
Training & Facilitation
Resources

TwitterLinkedInInstagram

Beth Kanter

Copyright © 2021 · by Beth Kanter. All right reserved. Graphic design by Eve Simon Creative. Website development by Cindy Leonard Consulting.