If you want extract value from your social media strategy, you need to use measurement. That means setting measurable goals, collecting the right data, making sense of it, and transforming it into actionable decisions. Sense-making is an essential workplace skill along with several others.
Robin Good curated this article about research on future workplace skills. (Found it via Curata’s collection). The skills are:
- Sense-making: ability to determine the deeper meaning or significance of what is being expressed
- Social intelligence: ability to connect to others in a deep and direct way, to sense and stimulate reactions and desired interactions
- Novel and adaptive thinking: proficiency at thinking and coming up with solutions and responses beyond that which is rote or rule-based
- Cross-cultural competency: ability to operate in different cultural settings
- Computational thinking: ability to translate vast amounts of data into abstract concepts and to understand data-based reasoning
- New media literacy: ability to critically assess and develop content that uses new media forms, and to leverage these media for persuasive communication
- Transdisciplinarity: literacy in and ability to understand concepts across multiple disciplines
- Design mindset: ability to represent and develop tasks and work processes for desired outcomes
- Cognitive load management: ability to discriminate and filter information for importance, and to understand how to maximize cognitive functioning using a variety of tools and techniques
- Virtual collaboration: ability to work productively, drive engagement, and demonstrate presence as a member of a virtual team
Robin aptly points out that these skills are also required for content curation. In a recent slide deck on the “Visualizing the Agency of the Future, Jess3 and Leslie Bradshaw also touch on new work place skills, emphasizing the importance of data visualization. They use this quote:
“The ability to take data – to be able to understand it, to process it, to extract value form it, to visualize it, to communicate is giong to be a hugely important skill in the next decade.”- Hal Varian, Google
I think these workplace skills are important for nonprofits, especially making sense out of data. What does that actually mean? How do you do it? Does it require some special gift?
Let’s dissect an act of sense-making using Facebook Insights. Your Facebook Insights analytics programs is most likely going to give you some “associated metrics.” If you look at this out of context, it become trivia. So, you must have an outcome or result identified and know how each metric you pick helps you take a step towards that outcome. The goal of my Facebook page is serve as a focus group to listen to nonprofit practitioners and their ideas, concerns, and needs to use social media effectively. My result metric is the number of good ideas and saved time getting those ideas that I get for blog posts, curriculum development, and presentations.
I know that in order to generate good ideas from network, I need to feed and tune it. By feeding, I’m talking about posting engaging and useful content that resonates. So, that’s my track content against two metrics on in the new FB Insights: Reach and Virality. That’s all well and good, but the data – in and of itself – is pretty useless unless I use my sense-making skills. Here’s how I do it:

1. Look for the Patterns
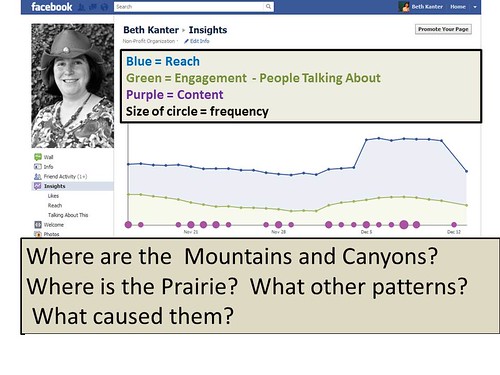
I check my insights monthly against my editorial calendar. The first step is to look at the visuals on the dashboard. The blue represents weekly reach. The green represents people talking about. And, those purple dots represent frequency of content. A bigger dots means more frequent postings, not dots means no content posted.
I like to use metaphors … so I ask: Where are the mountains? Where are the mountains? Where is prairie?

2. Look for Clues in the Canyon First
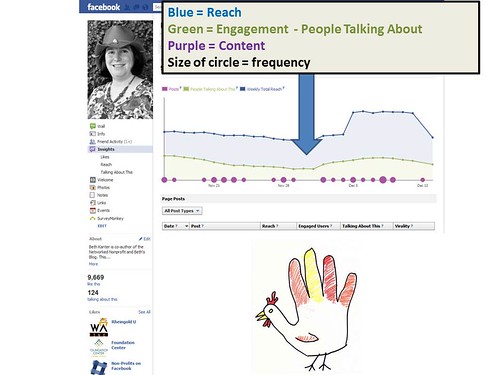
I immediately go to the low points, the canyons and the flat lines. Then I look at the date and carefully review what type of content and topics were posted. In the example above, I discovered a turkey in the canyon. It was Thanksgiving and I didn’t post. I’ve asked myself, should I make an effort to post everyday, even during holidays? Or should I post automatically even though it is likely to not get noticed as much as hand posting? For me, the numbers when back up, so I was glad I took a few days off.

3. Look for Clues in the Mountains
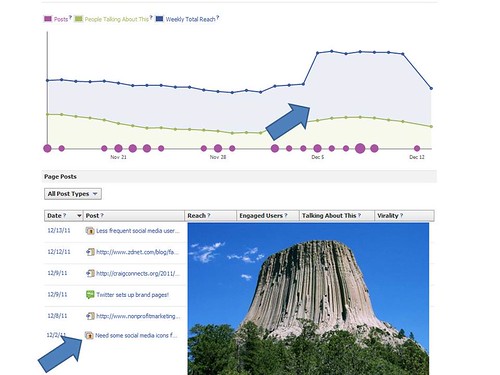
Over the years, I noticed different types of mountains and hills in my Facebook analytics and Google Analytics for that matter. One of them is the Devil’s Tower. A spike that stays high for a days. I get excited whenever I see a Devil’s Tower!

4. Analyze the Content
One of the posts that I shared during the “Devil’s Tower” period was visual of some social media icons with a note telling folks if they needed social media icons, here’s a good resource. In the comments, I shared the link to the post where I found it. So, this was practical information, visual, geeky, and fun.

5. Analyze the Comments
Next look at the comments and see if you can detect any patterns. Be sure to click through and look at the comments on shares too. I noticed that someone in network shared it with her network but calling it a “Fun Friday Share.”
6. Turn Insights To Actionable Decisions
All this is fun to do and interesting but so what? What I do is now relate this back to my content and goals. Remember, I was looking to encourage more engagement and interaction. So, what I do is write up content ideas for the next month. In this case, “Post geeky, visual, fun stuff on Fridays.” If you take a peak at my spreadsheet, you’ll see that I’m rather disciplined about learning – and include a “What did we learn” column to write down these insights so I have them at hand when I’m planning for the next campaign or the next editorial calendar.
If your takeaway from this post is, “hmm .. I should post geeky, visual, fun stuff on Fridays on Facebook” then you’ve missed the point. It is more important to practice and sharpen your sense-making skills – the process I just took you through.
What have you learned from analyzing your social media data? How do you transform data to actionable insights and decisions?
