Your numerical data can tell stories, but can stories be data that leads to continuous improvement? Do numbers only matter?
There are lots of debates in the amazing world of measurement and learning.
The only valid data is quantitative data
Real time analysis is not useful because it is drive by analysis
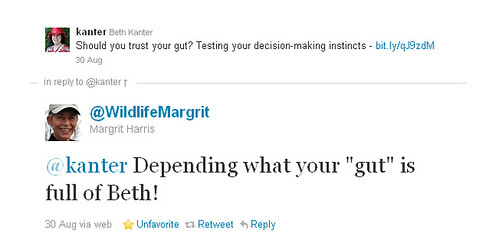
Make data-driven decisions only, don’t trust your gut ever
Only measure impact, not process
And so it goes ……

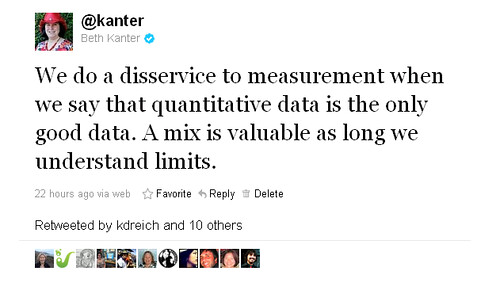
Yesterday I came to the conclusion that it isn’t an either/or, but a both/and. I shared this on Twitter and the conversation brought out some interesting points that I curated in “Storify,” a story telling tool. (And, had to laugh at the geeky recursiveness of creating a story out of qualitative data from Twitter and other sources – and then adding it to my curated nonprofit measurement collection on scoop.it)
The network on Twitter responded:
- If you’re overly emotional and reject quantitative data or unemotional and reject lived experience, you are less effective from Seth Godin shared by WSUCCSR
- It’s fitness for purpose and don’t forget a lot of quantitative data is rubbish from Dunc-Rintoul
- Will we ever move away from the either/or mindset from Jdeancoffey
- When the issue of interest moves from measurement for accountability/compliance to#evaluation for learning from Karcsig

Perhaps we are confusing qualitative data with gut decisions?
I like to use a combined method. I may start with numbers, but the process of collecting anecdotal information or stories in a structured way from your audience/stakeholders can help you generate insights about what those numbers actually mean. Or as @orgnet says, “Turning data into stories is the real trick.”
Another way is to let qualitative data inform a hypothesis that you go on to test with numerical data. Using unstructured qualitative data alone is pretty stupid unless you bring intelligence analysis, link to a quantitative analysis and link it back to decisions.
This leads to another question: How can you transform anecdotes into useful data?
Last week at the Packard Foundation, I participated in a conversation with Peter Laugharn, the Executive Director of Firelight Foundation about participatory learning agendas. Some of the techniques include analyzing narrative data in a structured way to test and refine a theory of change. This requires creating a culture of curiosity, a norm of continuous improvement, and leadership commitment — all hallmarks of a “data-driven culture” whether the data be numbers or stories.
As part of work as Visiting Scholar at the Packard Foundation this year, I’m facilitating a number of peer learning exchanges on measurement with grantees, including Global Giving and learned about their storytelling project which is an attempt to measure the effectiveness of how dollars raised are being used to create social change.
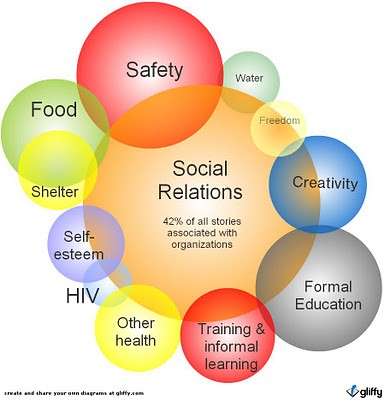
This approach is not about counting dollar signs, but about feedback loops which is discussed in Michael Quinn Patton’s new book on Developmental Evaluation. Storytelling Project is an experiment in collecting community feedback. They started by recording thousands of stories or 19,181 stories to be exact told by people from areas where GlobalGiving partners work.

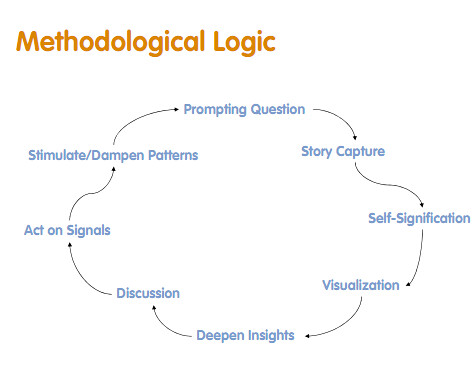
But how do deal with that much data? How do you make sense? First, with discipline and structure. Here’s their storytelling collection tool. They’re using software – called sensemaker – to see patterns in the data that is far too much for human brains to summarize. The synthesis – in the form of a presentation is shared with partners and more broadly.

The above shows the methods. Now, if you’ve read this far and you work in a small nonprofit, you’re probably feeling overwhelmed. I am too, just a little. It made we wonder about how one can create a small scale, manageable method for a small organization to collect stories and use them as a feedback loop – AND part of their communications/content strategy.
The beauty of this — is that the stories work well as micro content and as an opportunity for engagement?
What do you think? I’m noodling and it gave me an excuse to play with storify as a sense-making tool.
Is your organization collecting stories or anecdotal data in a disciplined way that helps you with your content strategy? Is your organization leveraging this content asset further by using it as a continuous learning tool or marrying it to better understand your quantitative data?
