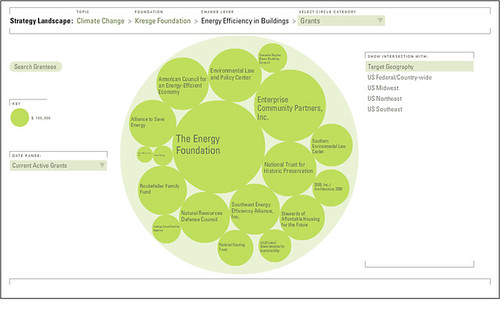
Monitor Institute and the Center for Effective Philanthropy (CEP) have launched a joint venture to bring a new data visualization tool, “The Strategy Landscape Tool” to the field of philanthropy. Created with support from the Rockfeller Foundation, the tool allows users to easily see and understand grantmaking strategies and patterns within and across institutions so they can make better decisions in pursuit of their goals.
This tool is important because it facilitates funders working in a networked way. Here’s why:
Philanthropy today is called upon to address increasingly complex and interrelated challenges that don’t adhere to traditional geographic, disciplinary, and sectoral boundaries—poverty, health care, climate change, and education to name a few. They are what design theorist Horst Rittel called “wicked problems”—complicated, continuously shifting issues where neither the problem nor the solution may be clear or stable.
No single funder or institution alone has the resources or reach required to move the needle on wicked problems. Foundations increasingly need to look beyond their organizations to other stakeholders—both in philanthropy and across sectors—to spot the opportunities, understand the challenges, and mobilize the effort needed to address pressing social issues.
Yet while most funders will readily acknowledge the importance of working together, collaboration remains more the exception than the rule. Working together remains a challenge, and simply knowing what other funders are supporting can require time-consuming research, meetings, and calls.
As funders increasingly recognize the advantages of collective action, it is also becoming clear that “peripheral vision”—the ability to see and develop an understanding of the system in which they operate—is a critical competency. The most successful funders will work from a rich understanding of their position and role within the ecosystem of other actors, donors, and investors. And they will regularly refresh their perspective so that today’s arrow is not aimed at yesterday’s target.

I had a demonstration of this tool and what was most powerful was its simplicity. Much like the blind men in the ancient story, funders see only the part of the “elephant” that their work touches, but cannot easily understand the pieces that others are touching or get a clear picture of the whole elephant.
The tool allows a group of funders working on a particular issue to share data around what they have funded – not just dollar amounts or types of initiatives, but how this links to their theory of change. The tool creates an interactive map across a problem area that reveals how much as been invested and where the gaps and opportunities are. It can also be used to look at a single foundation’s program area.

Leave a Reply